[This project has ended. All goals and objectives were met. These pages are kept for archival purposes. All publications are available through copyright holders (e.g., IEEE, ACM, etc.).]
VarViz
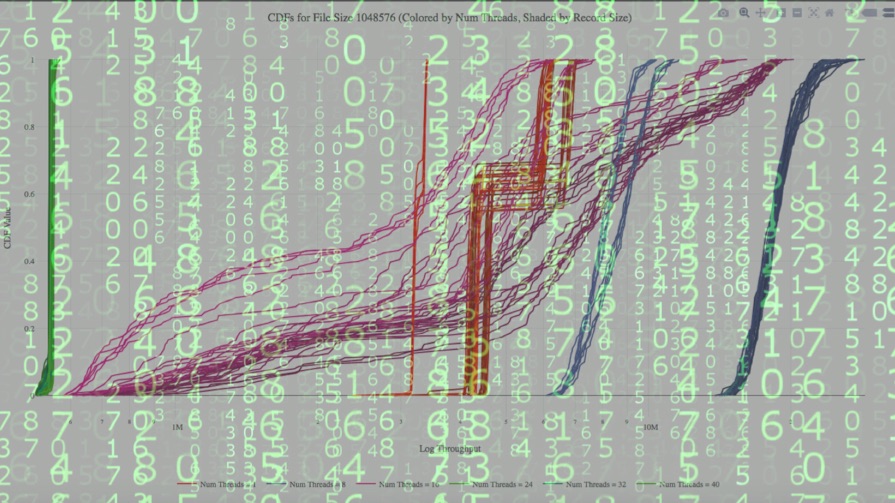
VarViz is a variability visualization tool we developed in-house as part of the VarSys framework to enhance project communications among the team members of diverse backgrounds (graduate and undergraduate students, staff, researchers, professors) and varying research areas (HPC, systems, security, cloud, statistics, mathematics, media relations, and education). The result is a tool that enables selection and isolation of system and application variables to visualize real-time renderings of previous variability measurements (tens of thousands of CPU hours of data collected by our teams). Additionally, the tool is agile software that has evolved with the project. As data sets are added by the systems teams, the VarViz team ensures the data can be visualized…sometimes in real time at our weekly meetings! As variability prediction models are added, the VarViz team also ensures the predictor accuracy can be observed via the tool as well.
The original author of the VarViz Tool is Thomas Lux, a member of the math and algorithms team in the VarSys project. The tool is a work in progress and at this time we cannot offer any support unfortunately. The demo linked above (or here) is an early version of VarViz that enables selection of various scheduler choices (e.g., Hyp, VM) and various I/O Zone parameters (e.g., File size, Record size, Number of Threads). The tool is still in prototype form but ultimately we hope to release a working version for public use. So stay tuned!
Note: The VarViz tool renders the graphs you see in real time. Your internet connection, the parameter choices, the current system resource used, etc. may slow your interactive experience with VarViz. Some of these issues have been fixed in later versions and will be released in time. For now, please try to be patient while the rendering takes place.